Chrome DevTools that will save your time
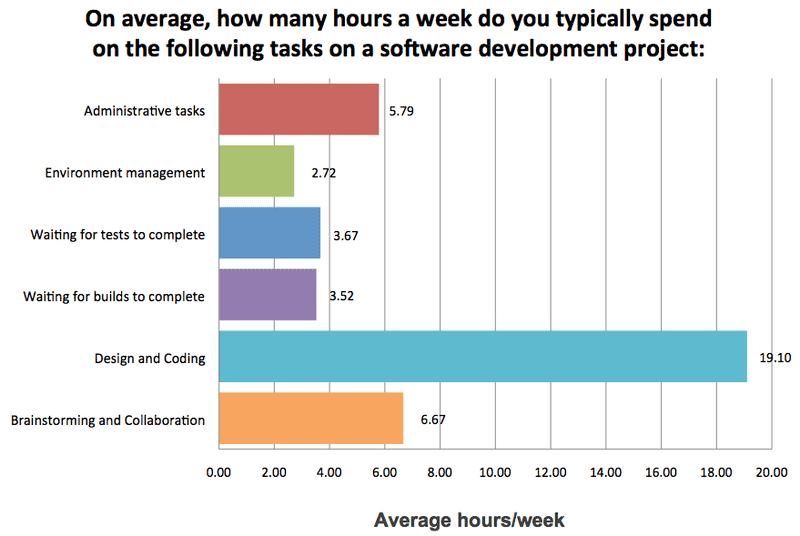
In a perfect world, a developer would spend his entire day doing what he’s supposed to do: writing code. In the real world, the time a developer spends “doing his job” is split between actual coding and tackling related tasks:
Now taking a look at the big slice of cake named Design and Coding, it makes me wonder: do developers actually spend that much timewriting code? The answer is definitely NO.
Analytics show that developers spend much more than 50% of their time during a day not coding, but debugging. (citeseerx.ist.psu.edu, coralogix.com)
Because Chrome is in top 5 of the most used browsers by developers (slant.co), here are few Chrome DevTools tips that will save a lot of your time:
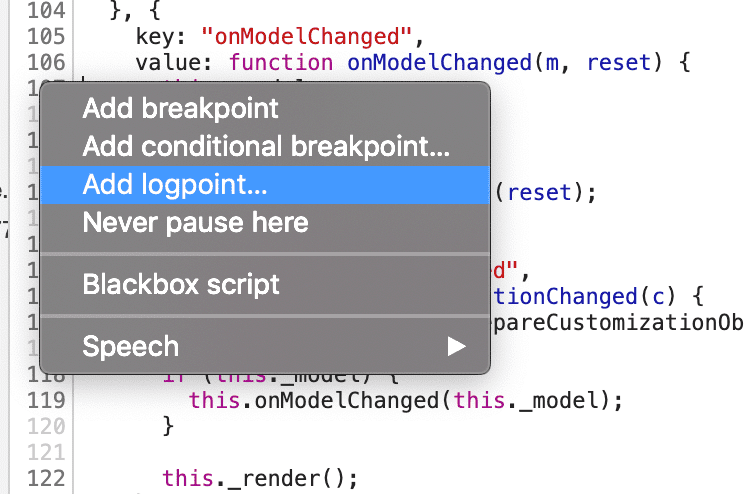
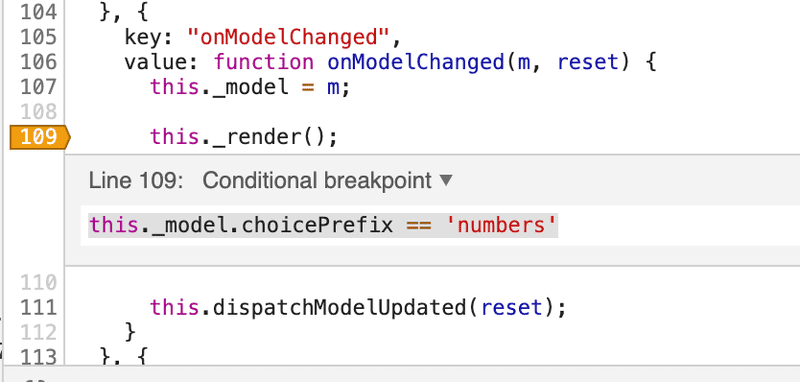
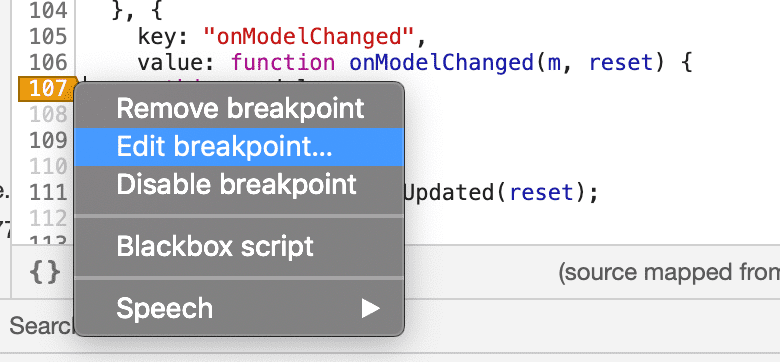
1. Add conditional breakpoints and logpoints
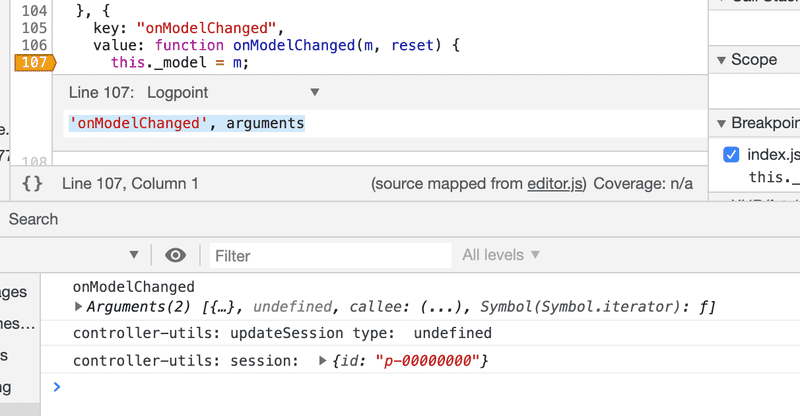
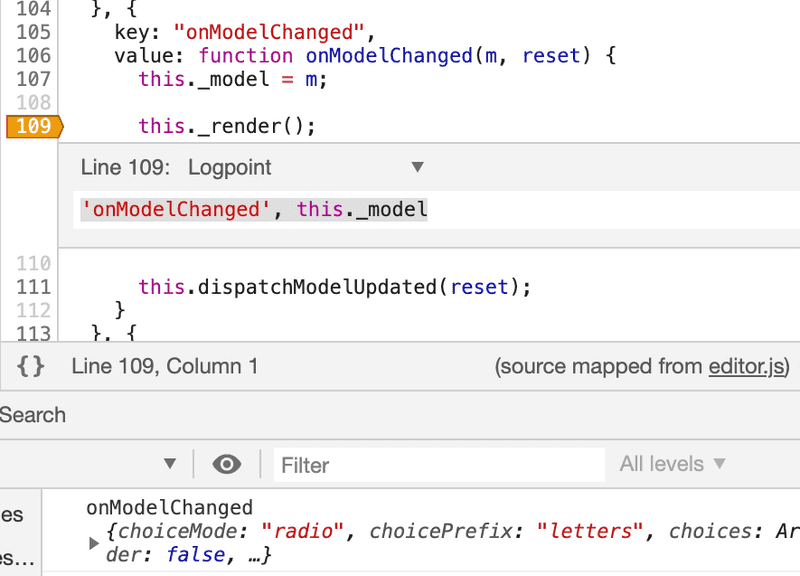
Instead of cluttering up your code with console.log() calls and wasting time waiting for the page to refresh after every new console.log() added, use logpoints to log messages to the console.
You have the “old” breakpoint option and 2 new ones: conditional breakpoint and logpoint.
Tip! When logging out a variable, wrap the variable in an object (e.g. { arguments }) to log out its name and value in the Console.
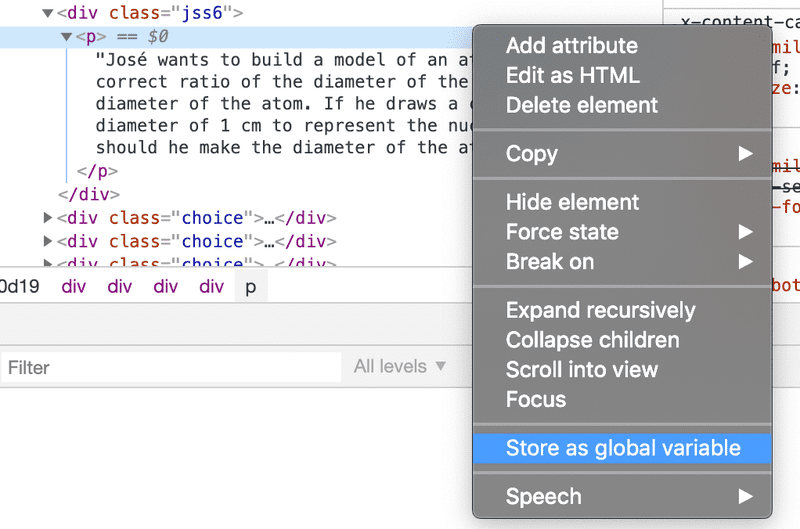
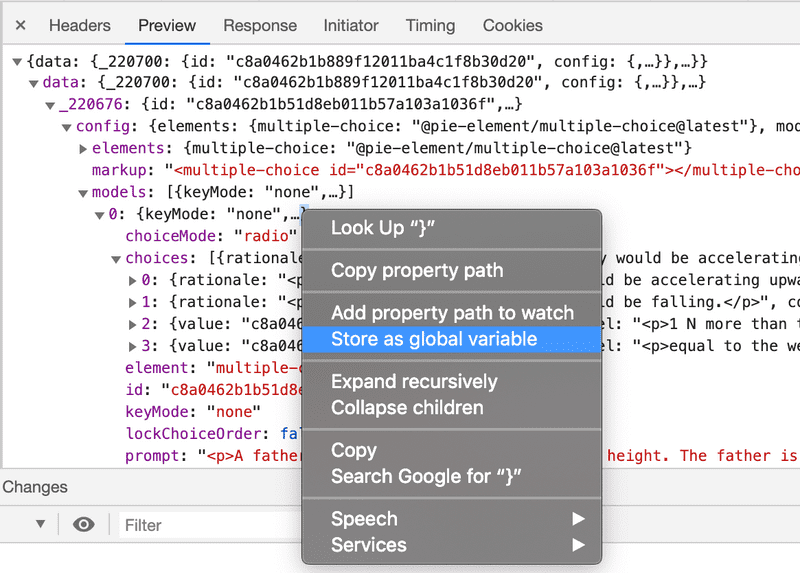
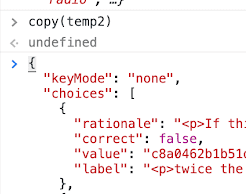
2. Store as global variables
You can use this on Elements or on Network Responses, just by Right click-ing the item that you want to store in a variable. It will create a global variable named “temp” + index (first one will be temp1, the next one will be temp2 and so on).
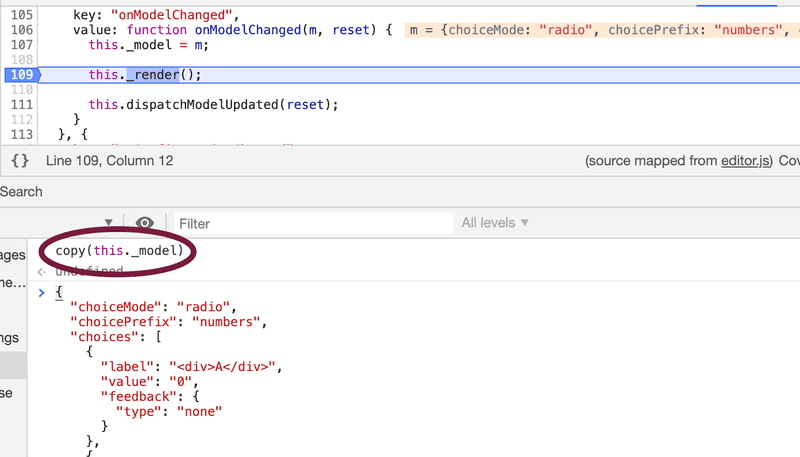
3. copy()
Use this function inside the console to copy anything to your clipboard.
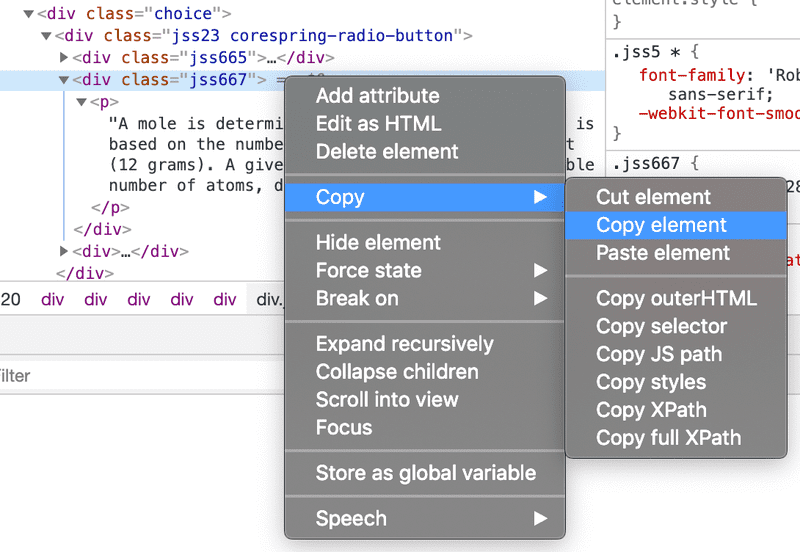
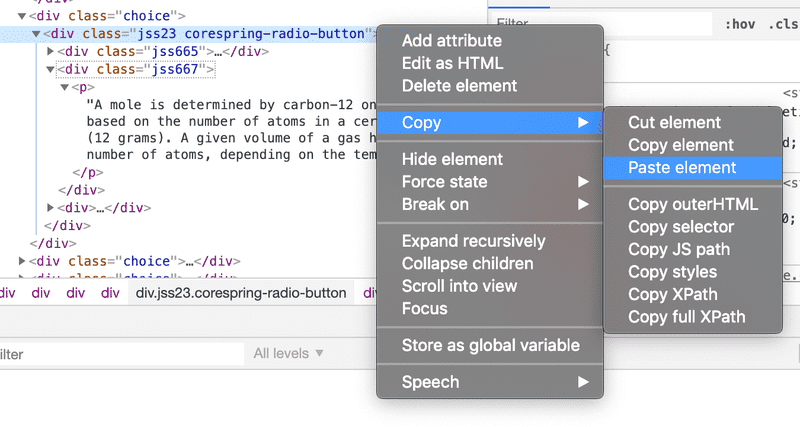
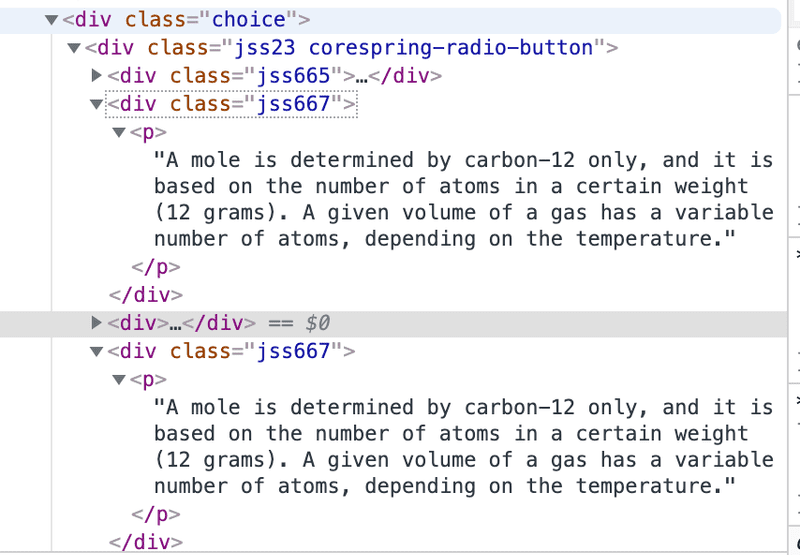
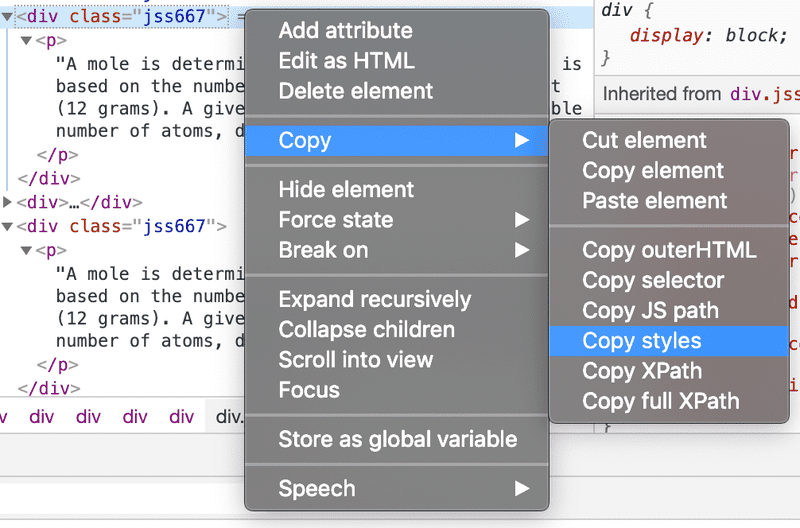
4. Copy & Paste element + Copy styles + Copy selector
Copy & Paste elements:
Copy selector or Copy JS Path:
Copy selector will copy to your clipboard the entire path to that element, for example:
While Copy JS Path will copy to your clipboard the selector, like:
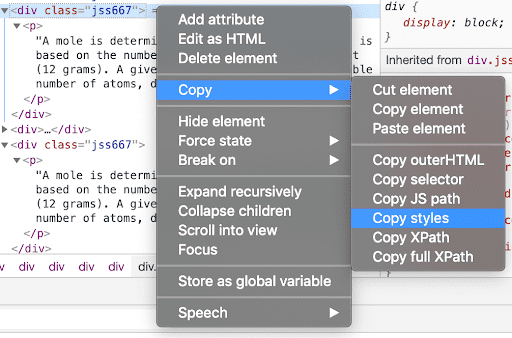
And the one I love the most, Copy style:
Instead of looking into all the style properties that the element inherited, you can simply copy it and observe all the style properties that the item has:
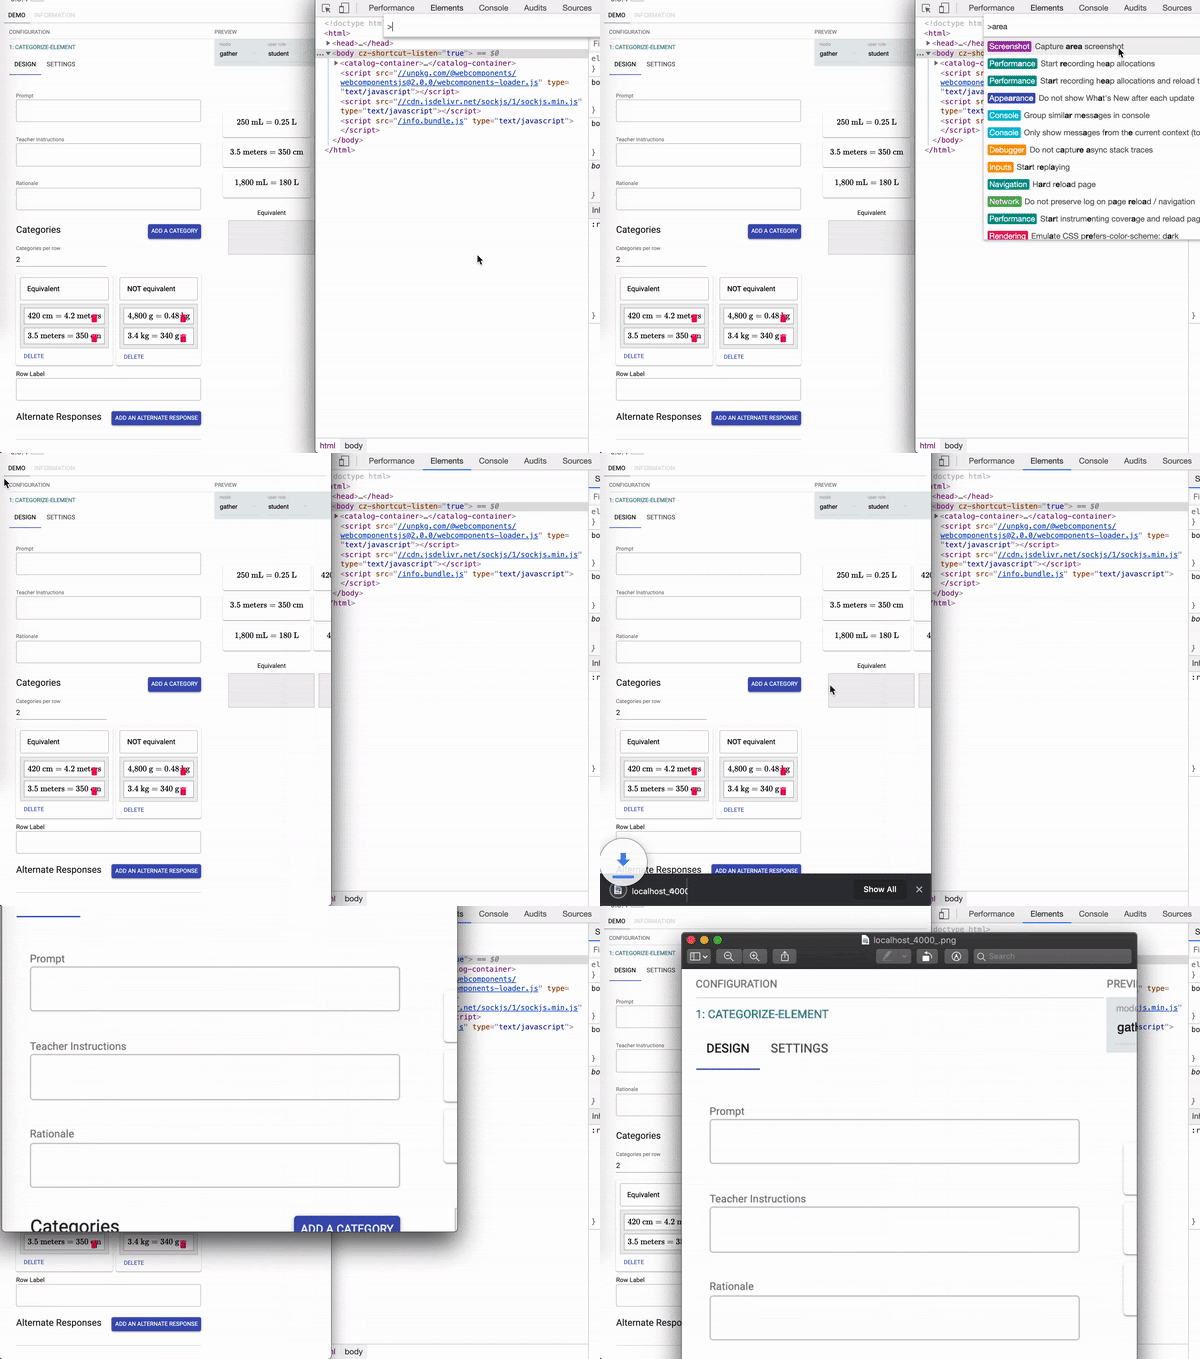
5. Screenshots
In DevTools, press Control+Shift+P or Command+Shift+P (Mac) to open the Command Menu, search for “area” and select “Capture area screenshots”. Focus the app page and drag your mouse over the section of the viewport that you want to screenshot. It will download a png of your screenshot:
6. Watch
Clicking the watch icon will help you pin a expression to the top of your console and you can monitor its value in real-time:
Simply use it with the debugger:

Or with global variables:
7. monitorEvents and unmonitorEvents
Use global variables to monitor the events that are related to them.
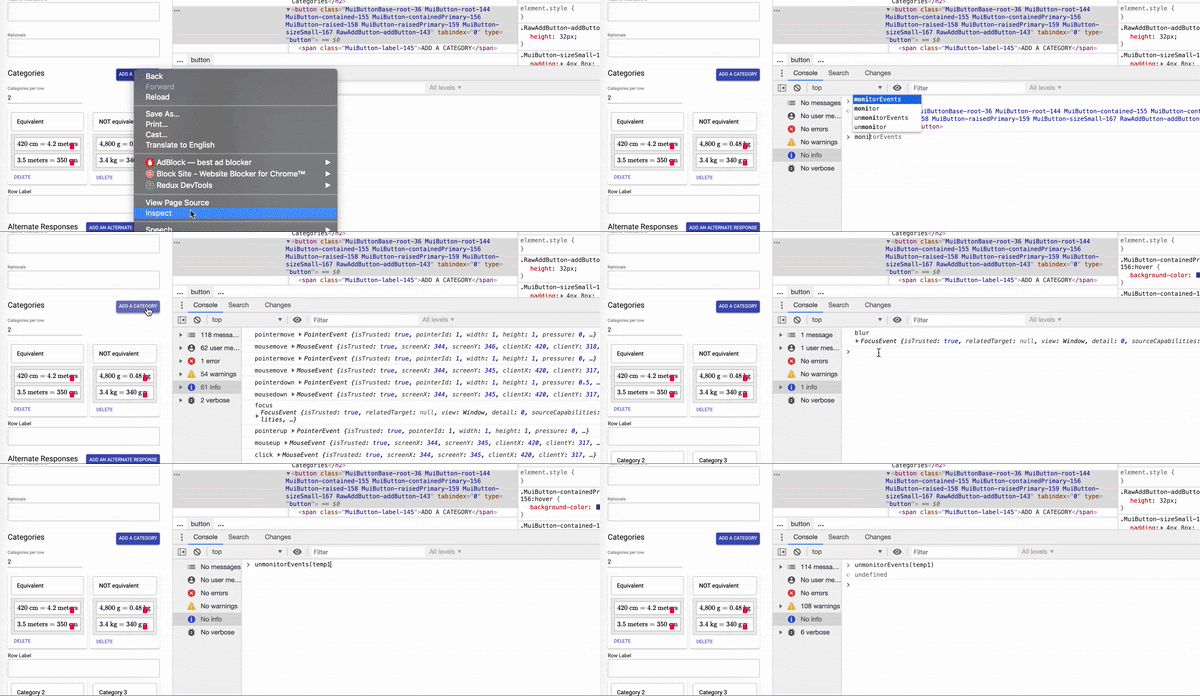
These might not come to hand at first, but once you start using them regularly you’ll notice a significant difference in the amount of time spent for debugging.
The tips that I picked up are the ones that I find extremely useful (with daily usage), but you can also look for other super awesome tips on https://developers.google.com/web/updates.
In conclusion, if the analytics are correct and as a developer you spend that much time debugging, make sure every second is well spent.
